5 minutes
Monitoring
This is how i finished here..
Choosing a monitoring tool for your Homelab: ELK vs. OpenSearch vs. Loki
If your goal is to dive into log analysis and build correlation rules, you will quickly come across a few major players. Here is a quick breakdown of your options. Personally, I wanted to explore logs and deep analysis, and I started searching, I had some basic knowledge about some solutions, but here are my findings.
1. The ELK Stack
ELK is the historical giant of Open Source SIEMs.
- Elasticsearch: The heart of the system, a powerful search and analytics engine.
- Logstash: The heavy-duty data processing pipeline that ingests, transforms, and ships logs.
- Kibana: The visualization frontend used to build security dashboards and track correlation rules.
The Homelab Catch: ELK is incredibly powerful, but it is an absolute resource hog. Elasticsearch requires significant amounts of dedicated RAM to run its full-text indexing. So I’ve chosen another solution.
For me a really good choice, but a bit heavier than I expected. I keep searching about other solutions.
2. OpenSearch
Born as an open-source fork of Elasticsearch and Kibana after Elastic changed its licensing, OpenSearch is AWS’s community-driven alternative. It behaves almost identically to ELK, offering robust security features and SIEM capabilities right out of the box, but it shares the exact same high-hardware requirements.
3. My Alternative: Loki + Grafana
I’m running a homelab heavily based on docker containers, the combination of Grafana Loki Alloy was a good candidate for me. Because it avoids heavy full-text indexing, setting it up with containers is extremely simple, lightweight, and takes only a few minutes to get running.
Here is a small comparison about the solutions.
| Feature | ELK Stack / OpenSearch | Loki + Grafana |
|---|---|---|
| Philosophy | Indexes everything (full-text indexing of log messages). Ultra-powerful but heavy. | Indexes labels only (metadata like container name, service). Raw log text is compressed. |
| RAM / Disk | Very Heavy. Elasticsearch/OpenSearch will greedily devour your RAM and storage. | Ultra-Lightweight. Designed to be budget-friendly and fast to run (perfect for your Alloy setup). |
| Search Speed | Instantaneous across billions of lines (thanks to the massive inverted index). | Fast when filtering by specific labels, but slower if searching for random words across terabytes of data. |
Let’s breakdown the working
The Data Flow in 3 Steps
Sources ──> Parsers ──> Shipping (Loki)
Step 1 — Collection Where to look? loki.source.file, loki.source.journal
Step 2 — Transformation How to sort? loki.process
Step 3 — Shipping Where to send? loki.write
How it works: The blocks do not work alone. They are literally plugged into each other thanks to the
forward_toproperty, which propels data from one step to the next.
The config.alloy file is very important this is the brain of the agent. Written in the River language, it defines and connects components to automate the data management.
It is important to note that this setup is highly flexible. You can define multiple source.file blocks and multiple parsers. This allows you to ingest as many different log files as you need—whether they are SSH logs, web access logs, or error logs—and apply a specific parsing logic to each data stream.
Here is an example of a component that can be called inside Grafana.
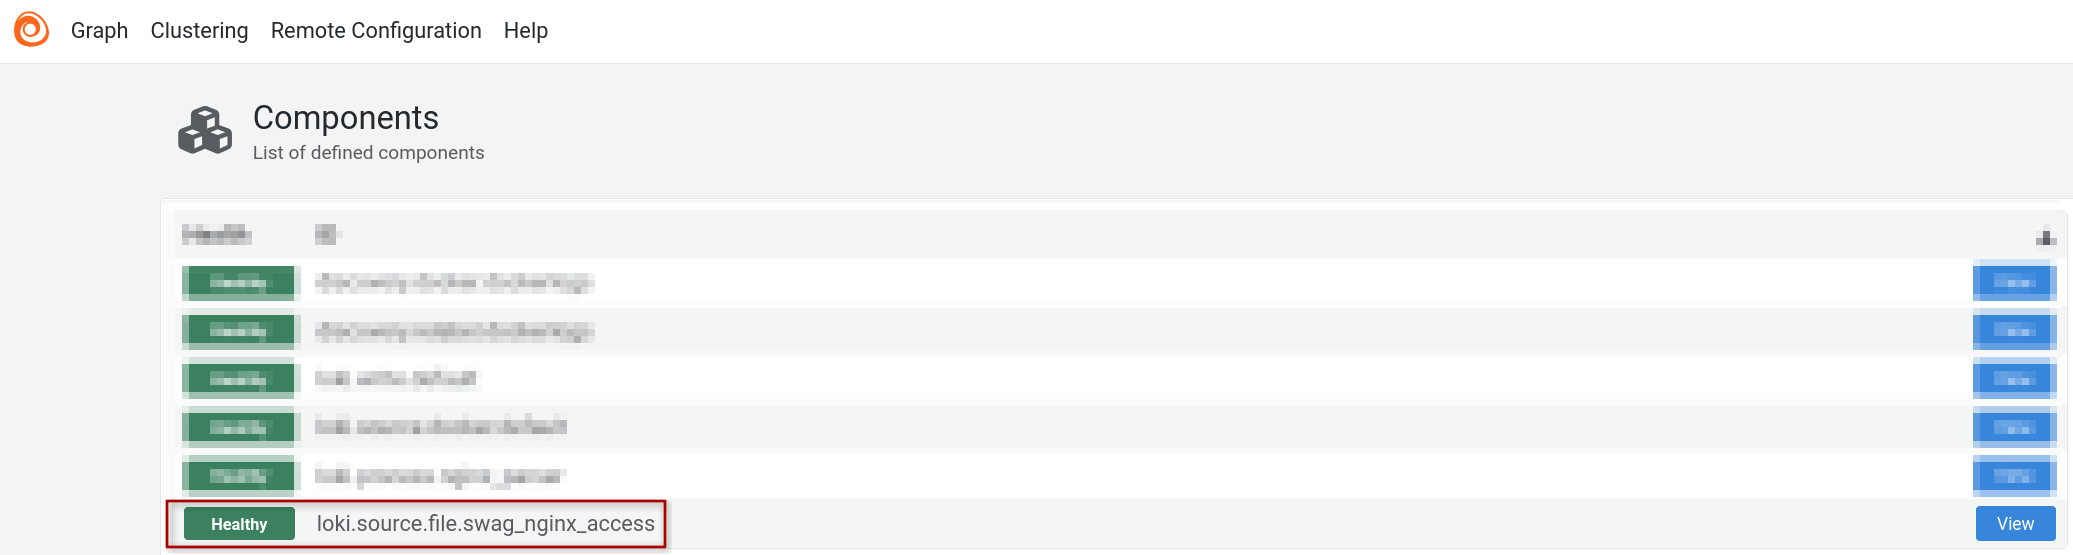
So on each remote server I deployed my Alloy agent, with the config files, I edit it when I don’t need same logs. To practice and use Ansible, I could create a playbook i think but maybe later.
// 1. COLLECTION: Monitors the SWAG log file
loki.source.file "swag_nginx_access" {
  targets = [
    {"__path__" = "/var/lib/alloy/swag-access.log"},
  ]
  forward_to = [loki.process.nginx_parser.receiver]
}

// 2. TRANSFORMATION: Splitting the log line and creating labels
loki.process "nginx_parser" {
  stage.regex {
    expression = "(?P<ip>\\S+) - - \\[(?P<timestamp>[^\\]]+)\\] \"(?P<verb>\\S+) (?P<path>\\S+) (?P<protocol>\\S+)\" (?P<status>\\S+) (?P<size>\\S+) \"(?P<referer>[^\"]*)\" \"(?P<user_agent>[^\"]*)\""
  }

  stage.labels {
    values = {
      verb   = "verb",
      status = "status",
    }
  }

  stage.timestamp {
    source = "timestamp"
    format = "dd/MMM/yyyy:HH:mm:ss Z"
  }

  forward_to = [loki.write.default.receiver]
}

// 3. SHIPPING: Dispatches cleaned logs to Loki
loki.write "default" {
  endpoint {
    url = "http://loki:3100/loki/api/v1/push"
  }
}
Code
I am by no means a docker compose professional; I used examples found on the website and various blogs.
There is some piece of my docker compose file. Github
If you are managing multiple servers, you can easily distinguish between them by adding custom metadata tags.
Test
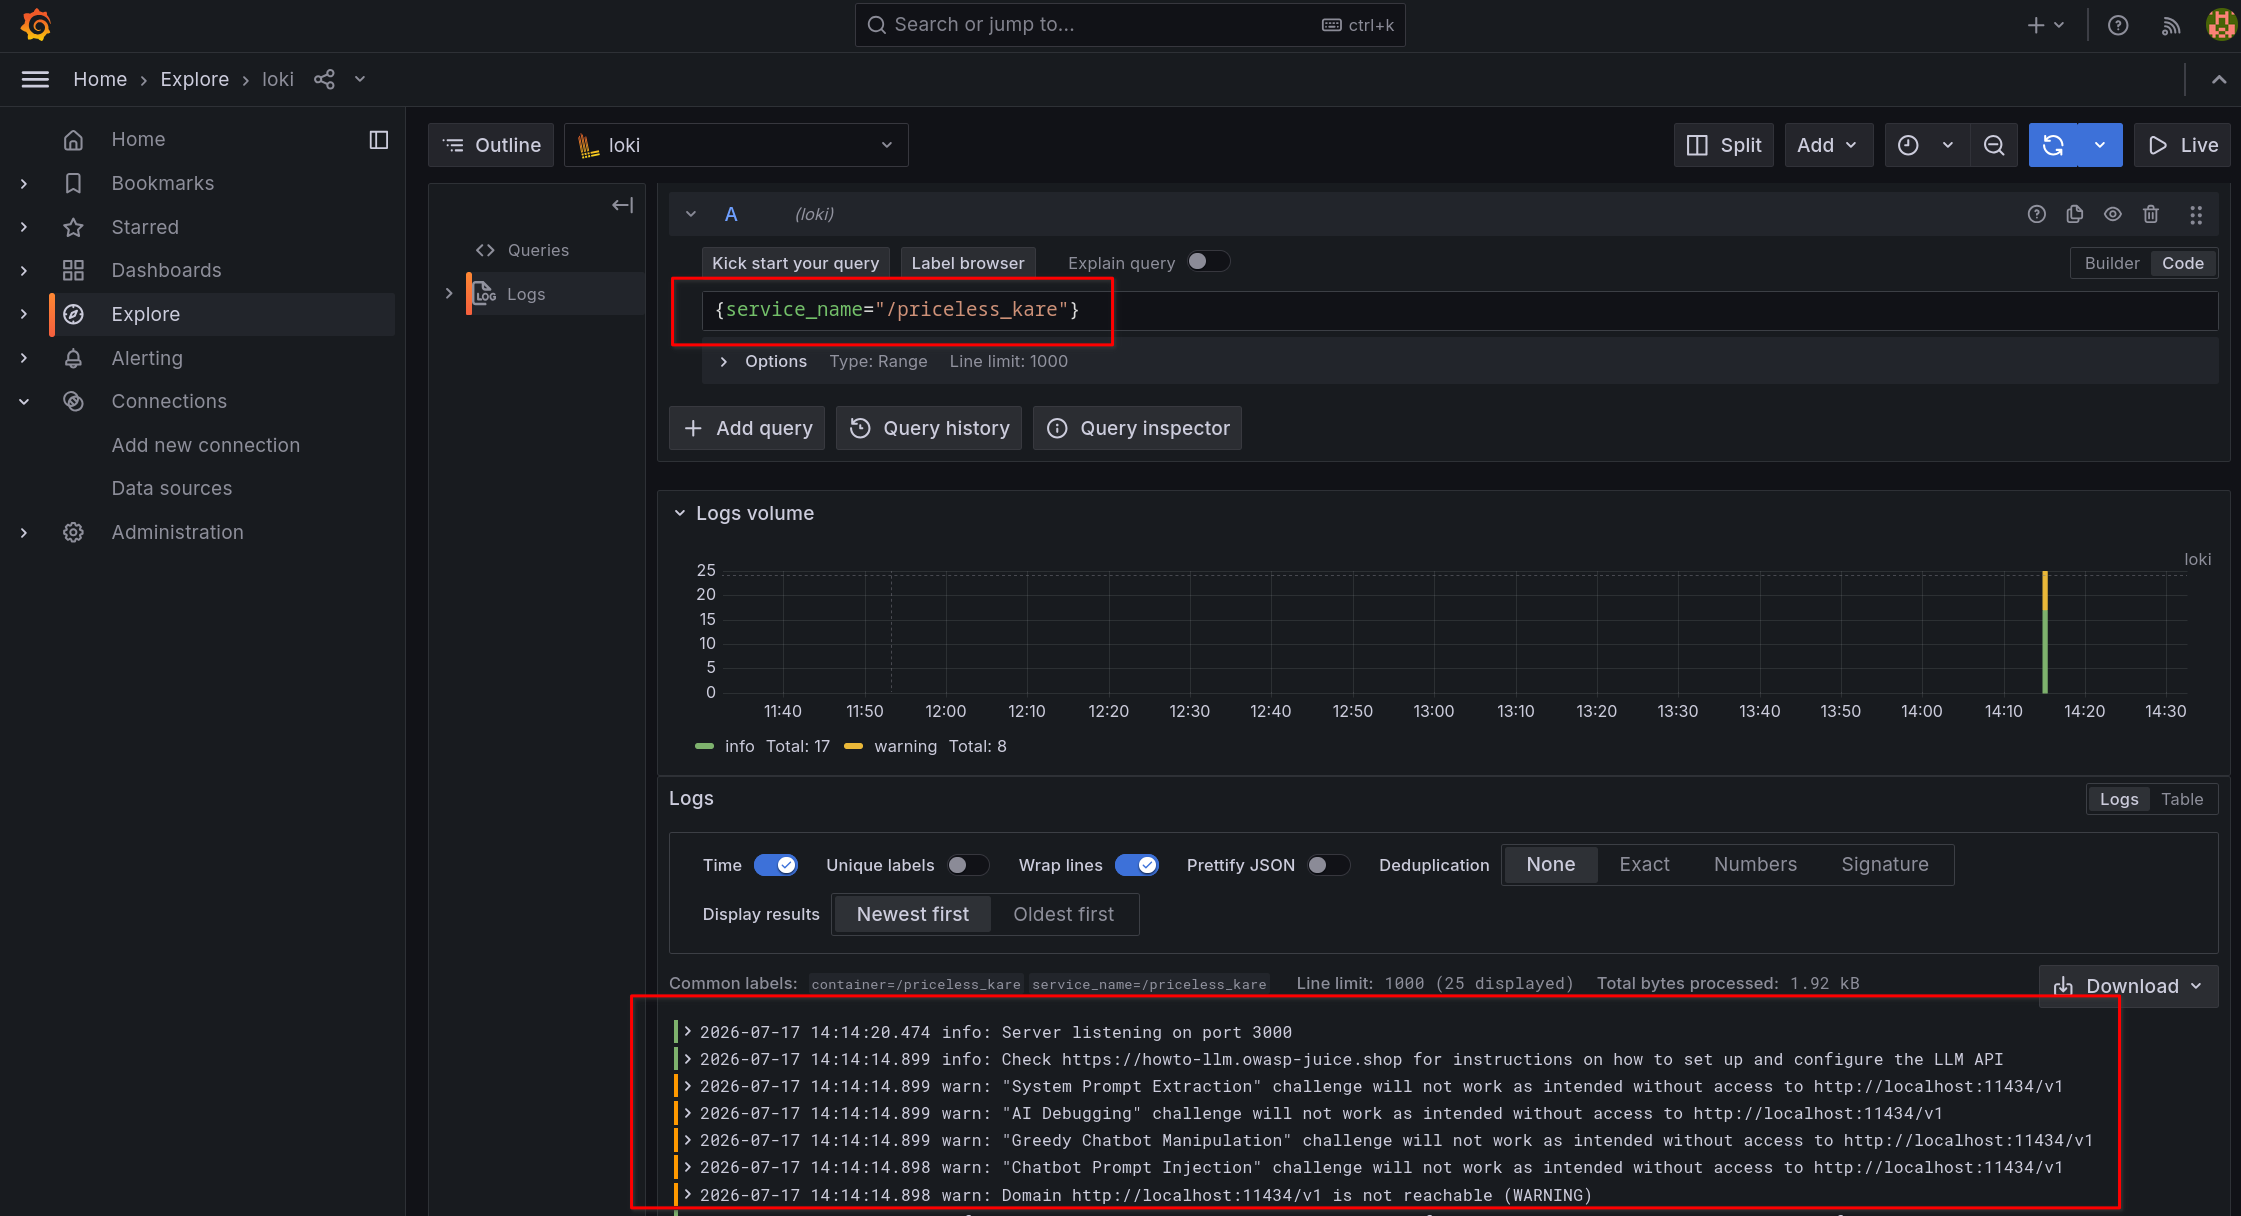
In this view, you can clearly see the logs from the OWASP Juice Shop container, including the output. I have also configured it to retrieve web access logs generated during security challenges. I find the container with the service_name attribute and I configured the adress to be loki:3100.
Conclusion
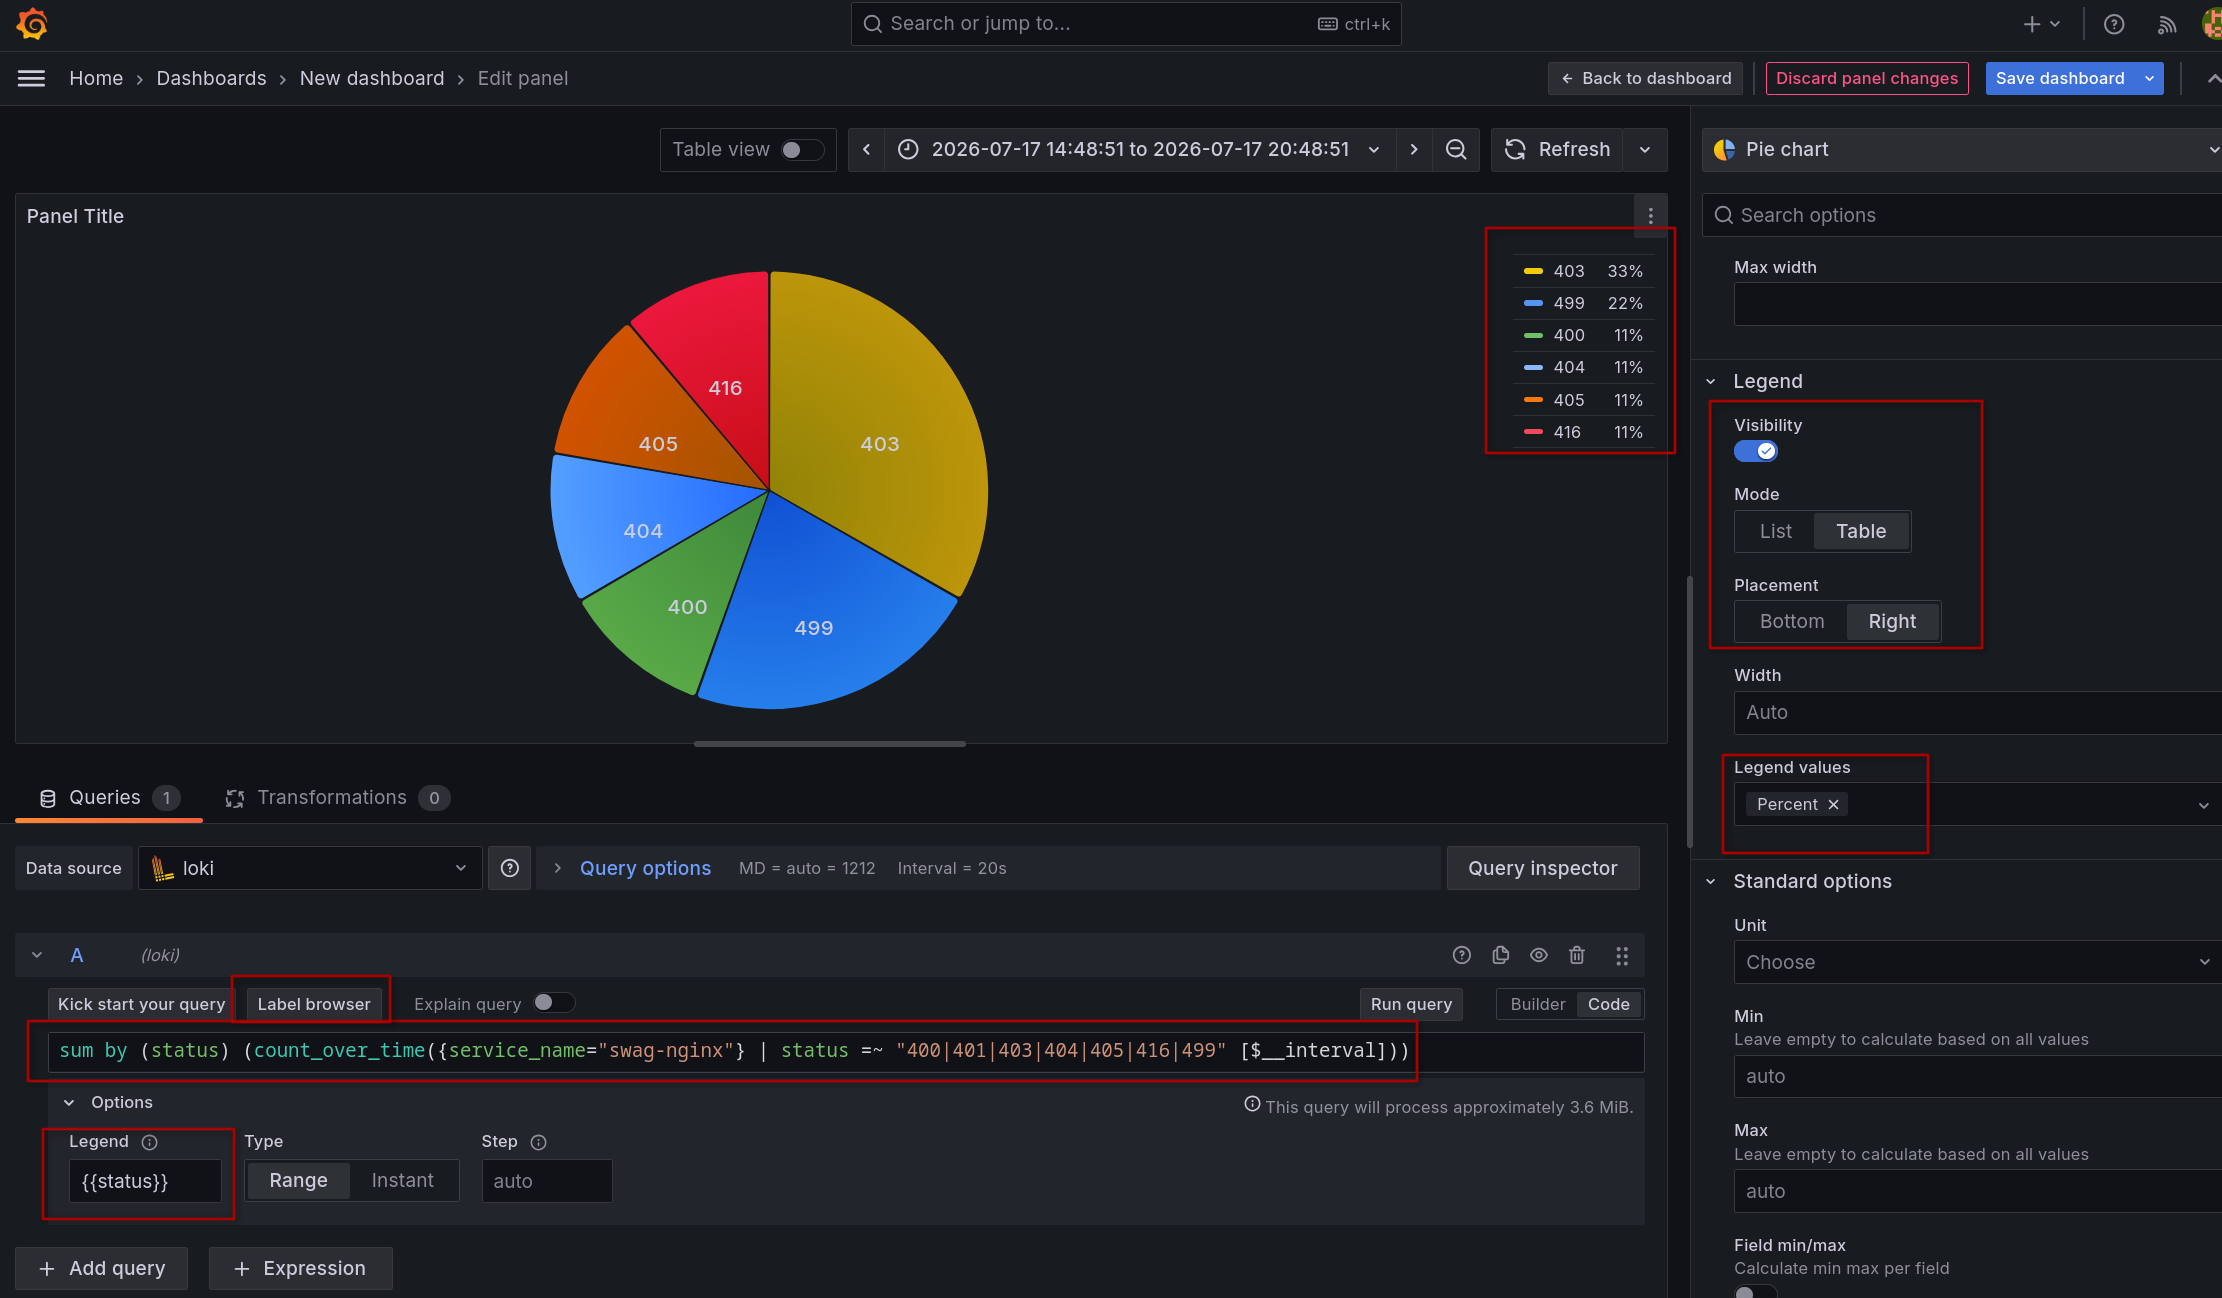
This chart aggregates the “background noise” of automated scans and suspicious requests blocked by my server:
I added some errors code to have a larger view.
403 (forbidden access) and 499 (impatient bots closing the connection before receiving an answer) represent the vast majority, proving that my reverse proxy is effectively blocking intruders. The rest is split between 404 (scanners searching for non-existent pages or random vulnerabilities) and the 400 / 405 / 416 trio, which betrays malformed requests, forbidden HTTP methods, or invalid file requests generated by hacking tools.
I have centralized the logs I wanted, and I am going to create dashboards to monitor my servers. Feel free to do whatever you want; it is highly modular, and personally, I am not done playing around with it.
You can for example, set up automatic alerts (Discord, Telegram, or via email) if an IP generates more than 50 connection errors in less than a minute, I plan next to set up crowdsec docker.
Enjoy.